
Measuring Your Growth Efficiency
The SaaS quick ratio is like your business's health monitor — it reveals how efficiently your subscription company is growing by comparing what you're gaining against what you're losing. If you've ever wondered whether your growth is truly sustainable, this is the number that tells the real story.
SaaS Quick Ratio Formula:
(New MRR + Expansion MRR) ÷ (Churned MRR + Contraction MRR)
Let's be honest — not all growth is created equal. Your monthly reports might show impressive revenue increases that have everyone high-fiving, but those headline numbers could be hiding a troubling reality. Are you gaining $100K in new business but silently losing $90K out the back door? That's where the SaaS quick ratio comes in, cutting through the noise to show whether you're building something sustainable or just running faster to stay in place.
This powerful metric was coined by venture capitalist Mamoon Hamid and has since become a favorite tool for both investors sizing up SaaS companies and operators trying to build businesses with staying power. Traditional growth metrics often tell only half the story — the good half. The quick ratio gives you the complete picture by factoring in both your wins (new customers and upsells) and your losses (customers who leave or downgrade).
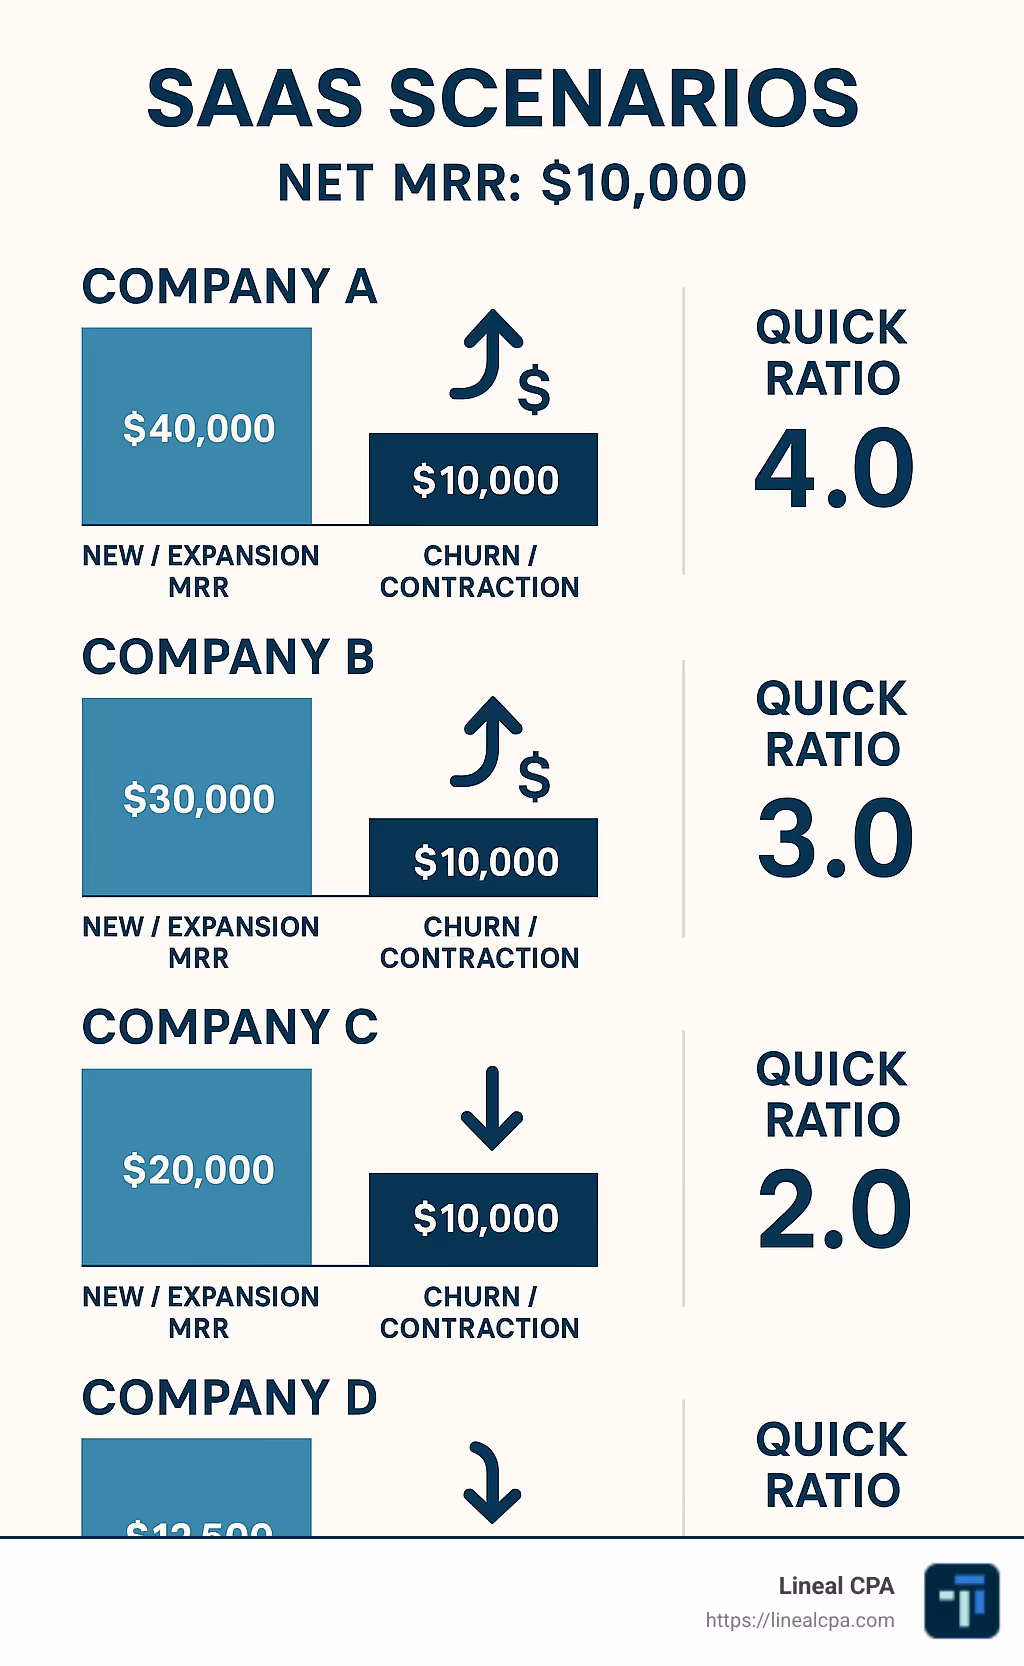
Think about it this way: if your team brings in $40,000 in new monthly recurring revenue but you're losing $10,000 to churn and downgrades, your quick ratio would be 4.0. This means you gain $4 for every $1 lost — much more insightful than just knowing you had a net gain of $30,000. A company with the same $30,000 net gain but a ratio of 1.5 is in a very different (and more precarious) position.
For growing SaaS companies, especially those transitioning from basic tools like QuickBooks to more robust platforms like NetSuite, tracking this metric becomes significantly easier with proper financial infrastructure. The right systems make it possible to monitor this crucial indicator without spreadsheet gymnastics.
Here's what the benchmarks tell us:- Below 1: You're in the danger zone — losing more than you're gaining. Time for immediate action.- 1-4: You're in average territory — growing, but with room for improvement in retention and expansion.- Above 4: You've achieved healthy, efficient growth that investors love to see.

For those diving deeper into SaaS financial metrics, you might also want to explore related concepts like subscription revenue accounting, broader financial metrics for SaaS companies, or how to build a robust SaaS revenue forecast model.
What is the SaaS Quick Ratio?
Imagine having a speedometer for your subscription business that doesn't just show how fast you're growing, but how efficiently you're doing it. That's essentially what the SaaS quick ratio gives you.
This powerful metric cuts through the noise of traditional growth measurements by comparing what you're gaining to what you're losing. Unlike basic revenue metrics that might have you celebrating top-line growth while a dangerous churn problem lurks beneath the surface, the quick ratio tells the complete story.
The metric was introduced to the SaaS world by venture capitalist Mamoon Hamid of Social Capital during the first SaaStr Annual conference. While he borrowed the name from a traditional accounting liquidity measure, the SaaS quick ratio serves an entirely different purpose in the subscription economy.
At its heart, this ratio answers a fundamental question every subscription business needs to ask: "For every dollar of revenue we lose, how many dollars are we gaining?" It's like taking the pulse of your subscription model's health – revealing whether you're truly building momentum or just running faster to stay in place.
What makes this metric particularly valuable is how it exposes issues that might otherwise remain hidden. A company could report impressive 15% monthly growth while simultaneously losing 10% of its revenue to churn – creating an unsustainable model that demands ever-increasing (and expensive) customer acquisition just to maintain growth rates.
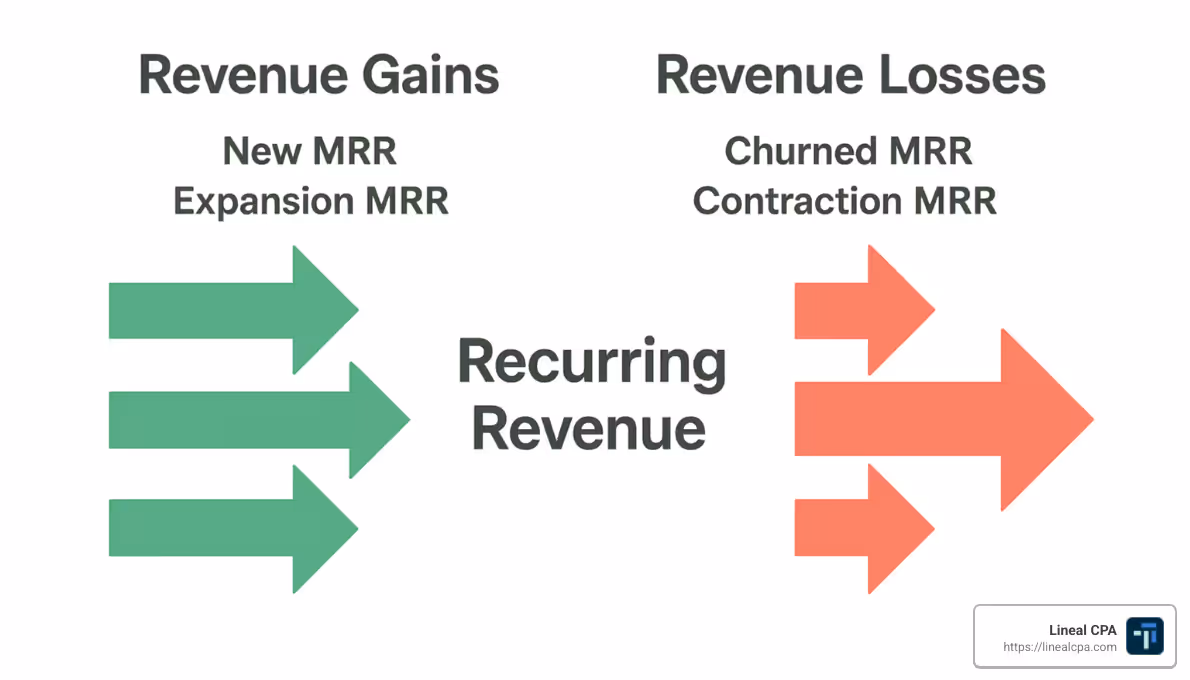
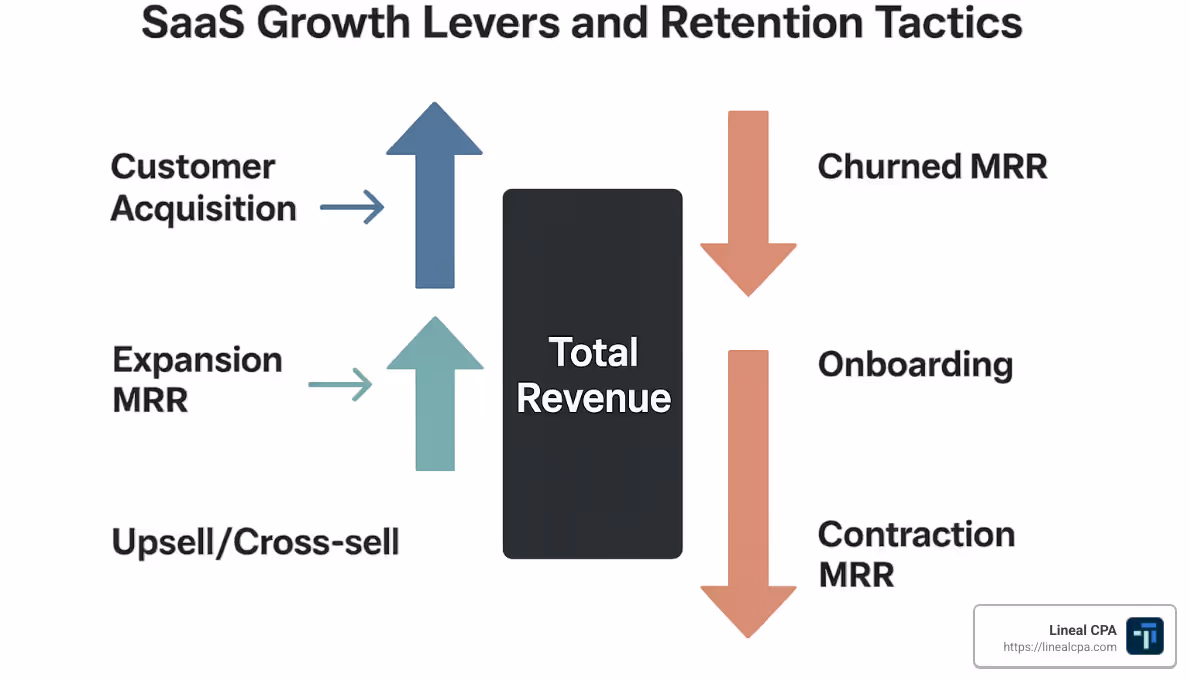
Core Components of the SaaS Quick Ratio
To really understand the SaaS quick ratio, you need to know the four key ingredients that make up this formula:
New MRR represents fresh revenue from first-time customers who've started paying for your service. This reflects your ability to attract new business and is the most obvious form of growth most companies track.
Expansion MRR captures additional revenue from existing customers who upgrade plans, buy add-ons, or otherwise increase their spending. This revenue from upsells and cross-sells is often the most profitable growth channel since acquisition costs were already paid.
Churned MRR measures revenue lost from customers who completely cancel their subscriptions. These are the customers who've entirely left your service, taking their recurring revenue with them.
Contraction MRR accounts for reduced revenue from customers who downgrade to lower-priced plans or reduce usage. While these customers haven't abandoned ship completely, they're now contributing less to your bottom line.
These components work together to determine your overall revenue health:
Your revenue inflows (New MRR + Expansion MRR) represent all the fresh money coming into your business each period. Your revenue outflows (Churned MRR + Contraction MRR) show what's walking out the door. The difference between these gives you your Net New MRR.
But the SaaS quick ratio goes a step further by showing the relationship between these numbers – revealing whether your growth engine is running efficiently or if you're leaking too much fuel along the way.
How to Calculate the SaaS Quick Ratio
Ready to crunch some numbers? Calculating the SaaS quick ratio is actually simpler than it might sound. At its heart, the formula looks like this:
SaaS Quick Ratio = (New MRR + Expansion MRR) ÷ (Churned MRR + Contraction MRR)
Think of this as comparing what you're gaining against what you're losing. The top half (numerator) represents all the new money coming in, while the bottom half (denominator) shows all the revenue slipping away. This neat comparison tells you whether your subscription business is growing efficiently or just treading water.
Let's walk through a real-world example. Imagine your SaaS business had these numbers last month:- You brought in $400,000 from brand new customers (New MRR)- Existing customers upgraded their plans, adding another $200,000 (Expansion MRR)- Unfortunately, some customers canceled, costing you $100,000 (Churned MRR)- Others downgraded their plans, reducing revenue by $50,000 (Contraction MRR)
Plugging these into our formula: ($400,000 + $200,000) ÷ ($100,000 + $50,000) = $600,000 ÷ $150,000 = 4.0
A ratio of 4.0 means you're gaining $4 for every $1 lost – that's healthy growth that would make investors smile!
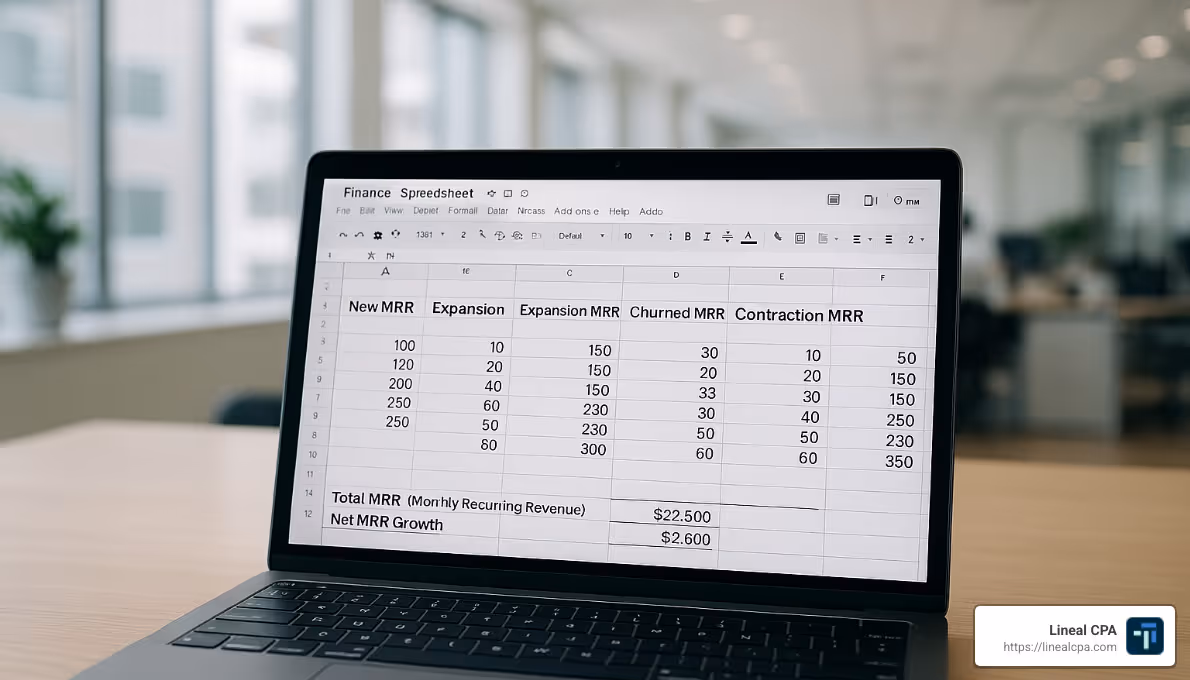
While many early-stage companies track these numbers in Excel, more mature organizations automate this calculation. At Lineal CPA, we help clients set up custom dashboards in NetSuite that calculate the SaaS quick ratio automatically, freeing up your time to actually improve the number rather than just measuring it.
Want to incorporate this metric into your broader financial planning? Our guide on SaaS Revenue Forecast Models shows you how to build this into your projections.
Step‑by‑Step Formula & Data Sources
Getting an accurate SaaS quick ratio requires clean data and consistent measurement. Here's how to make it happen:
First, decide on your measurement period – monthly calculations work best for most companies, but quarterly might make sense if you have longer sales cycles or fewer transactions.
Next, gather accurate MRR data from your systems. This is where many companies stumble. Your CRM (like Salesforce) might track new deals, but are those numbers matching what actually gets billed? Your billing platform (Stripe, Chargebee, Recurly, etc.) contains the truth about what customers are actually paying. For the most complete picture, an ERP system like NetSuite can consolidate all this financial data in one place.
The trickiest part often comes with properly categorizing your revenue movements. When a customer changes their subscription, is it truly expansion revenue or just a plan change? Are you separating true churn (customers who leave) from contraction (customers who downgrade)? These distinctions matter for accurate calculations.
Watch out for common data pitfalls that can skew your ratio. One-time implementation fees aren't recurring revenue and shouldn't be counted as new MRR. Similarly, temporary promotional discounts need special handling – when they expire, that's not really expansion revenue.
If you're fortunate enough to have zero churn in a period (it happens!), your ratio is technically infinite. In reports, we typically mark this as "N/A" or "∞" while recognizing it's a fantastic temporary situation.
SaaS Quick Ratio vs. Acid‑Test Quick Ratio
Don't let the similar names fool you – the SaaS quick ratio has almost nothing in common with the traditional accounting quick ratio (also called the acid-test ratio). They're entirely different metrics that happen to share a name:
Purpose:
- SaaS Quick Ratio: Measures growth efficiency of recurring revenue.
- Acid-Test Quick Ratio: Measures short-term liquidity.
Formula:
- SaaS Quick Ratio: (New MRR + Expansion MRR) ÷ (Churned MRR + Contraction MRR).
- Acid-Test Quick Ratio: (Cash + Marketable Securities + Accounts Receivable) ÷ Current Liabilities.
What it shows:
- SaaS Quick Ratio: How efficiently a SaaS business is growing.
- Acid-Test Quick Ratio: How easily a company can pay short-term obligations.
Good benchmark:
- SaaS Quick Ratio: 4.0 or higher.
- Acid-Test Quick Ratio: 1.0 or higher.
Used by:
- SaaS Quick Ratio: SaaS operators, investors, venture capitalists.
- Acid-Test Quick Ratio: Creditors, investors, financial analysts.
Time focus:
- SaaS Quick Ratio: Forward-looking growth indicator.
- Acid-Test Quick Ratio: Point-in-time liquidity snapshot.
Industry specificity:
- SaaS Quick Ratio: Specific to subscription businesses.
- Acid-Test Quick Ratio: Applicable to all industries.
The traditional accounting quick ratio is all about liquidity – can your company pay its bills in the next 12 months? It looks at your most liquid assets (excluding inventory) compared to your short-term obligations.
The SaaS quick ratio, meanwhile, has nothing to do with your balance sheet or bill-paying ability. It's purely focused on measuring how efficiently your subscription business is growing its recurring revenue.
Both ratios provide valuable insights, but they serve completely different purposes. When someone at your SaaS company mentions "the quick ratio," it's worth clarifying which one they mean – the difference is significant!
Benchmarking & Interpretation
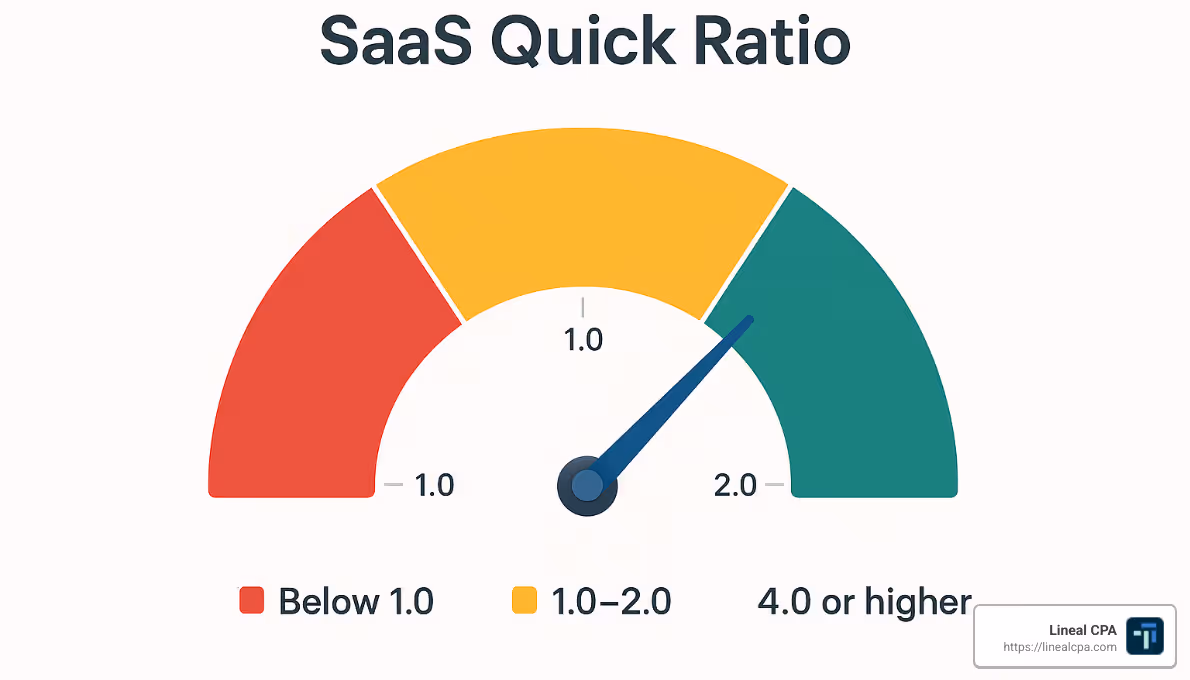
So you've crunched the numbers and calculated your SaaS quick ratio – now what? Understanding what your ratio actually means is where the real value kicks in. Think of your quick ratio as a health scorecard for your subscription business that tells a story about your growth efficiency.
Industry experts have established some clear benchmarks that help make sense of your results:
A ratio below 1.0 puts you squarely in the danger zone. This means you're losing more revenue than you're gaining – essentially, your business is shrinking. If you find yourself here, it's time for some immediate action to tackle that churn and boost new revenue streams.
If your ratio is exactly 1.0, you're breaking even – adding one dollar for every dollar lost. While you're not technically shrinking, you're working awfully hard just to stay in place. It's like running on a treadmill – lots of effort with no forward progress.
Most SaaS companies fall between 1.0 and 4.0 – this is average performance territory. The closer you are to 1.0, the more inefficient your growth; as you climb toward 4.0, you're becoming increasingly efficient at growing your business.
When your ratio hits 4.0 or above, congratulations! You've reached what most investors consider the threshold for healthy, efficient growth. At this level, you're adding at least $4 in new revenue for every $1 lost – a strong sign of product-market fit and scalable growth potential.
Some exceptional companies achieve ratios above 8.0, which is rare and often catches the eye of venture capitalists. However, sustaining this level long-term is challenging for most businesses.
These benchmarks aren't one-size-fits-all. A scrappy startup might need a ratio above 4.0 to attract investment, while a mature public SaaS company might operate just fine between 2.0 and 3.0 as it balances growth with profitability.
What is a Good SaaS Quick Ratio? (<1, 1‑4, >4)
What counts as "good" for your SaaS quick ratio largely depends on where your company is in its journey:
For early-stage companies (pre-Series B), the stakes are high. A ratio below 1.0 suggests fundamental problems with your product-market fit or go-to-market strategy. Between 1.0-2.0, you'll likely struggle to attract additional capital. A ratio between 2.0-4.0 shows moderate performance – acceptable if you're showing consistent improvement. Hit 4.0 or above, and you'll find investors much more interested in your next funding round.
Growth-stage companies (Series B to pre-IPO) face different expectations. A ratio below 1.0 is still a red flag requiring immediate attention. Between 1.0-3.0 needs improvement but might be acceptable if balanced with strong unit economics. A healthy 3.0-5.0 suggests you're efficiently scaling, while anything above 5.0 indicates exceptional performance that could position you for significant funding.
For mature SaaS companies (public or late-stage private), the standards shift again. Below 1.0 remains concerning and will impact valuation. A ratio between 1.0-2.0 might be acceptable if accompanied by strong profitability and cash flow. Most established players aim for 2.0-4.0, which represents solid performance, while anything above 4.0 is outstanding and may signal category leadership potential.
As Mamoon Hamid, who popularized this metric, put it:
"A SaaS quick ratio greater than four is good according to Mamoon Hamid and reflects a general consensus in the venture capitalist community."
This 4.0 benchmark has become the gold standard many investors use to evaluate SaaS businesses. But context matters – a bootstrapped company focused on profitability might thrive with a lower ratio, while a VC-backed business in hyper-growth mode needs to maintain higher numbers to justify continued investment.
Real‑World Scenarios & Case Studies
Let's bring the SaaS quick ratio to life with some practical examples that show how different growth patterns tell very different stories:
Scenario A: High Efficiency GrowthWith a new MRR of $10,000, expansion MRR of $2,000, churned MRR of $1,500, and contraction MRR of $500, this company achieves a net new MRR of $10,000 with a SaaS quick ratio of 6.0. They're gaining $6 for every $1 lost – an enviable position that signals strong product-market fit and customer satisfaction.
Scenario B: Moderate Efficiency GrowthThis company brings in $12,000 in new MRR and $3,000 in expansion MRR, but loses $4,000 to churn and $1,000 to contraction. They still achieve $10,000 in net new MRR, but with a SaaS quick ratio of 3.0 – solid but less efficient growth.
Scenario C: Low Efficiency GrowthWith $15,000 in new MRR and $5,000 in expansion MRR offset by $8,000 in churn and $2,000 in contraction, this company nets the same $10,000 MRR growth but with a SaaS quick ratio of 2.0. They're working twice as hard for the same net result compared to Scenario A.
Scenario D: Barely Sustainable GrowthThis company has to generate $22,000 in new MRR and $8,000 in expansion MRR just to overcome $16,000 in churn and $4,000 in contraction. They still achieve $10,000 in net growth, but with a concerning SaaS quick ratio of 1.25 – they're running hard just to move forward slowly.
The key insight? All four scenarios result in identical $10,000 net new MRR, but tell drastically different stories about business health and sustainability.
Consider an even more alarming example: The Leaky Bucket SaaS Company. Starting with $100,000 MRR, they add impressive new bookings of 20% ($20,000) monthly. However, with a monthly churn rate of 30% ($30,000), their SaaS quick ratio is just 0.67. Despite "growing" their new bookings by 20% monthly, they're actually shrinking by $10,000 each month. By year-end, they'll have lost over $120,000 in MRR – a cautionary tale of why looking at growth without considering churn tells an incomplete story. For more on this phenomenon, check out OpenView's analysis of SaaS growth metrics.
How to Improve Your SaaS Quick Ratio
When your SaaS quick ratio isn't where you want it to be, you're essentially facing a math problem with two sides to solve. Think of it like a seesaw – you can either add weight to the top (increase new and expansion revenue) or reduce weight from the bottom (decrease churn and contraction). The best approach? Do both simultaneously.
I've worked with dozens of SaaS companies who initially focused exclusively on acquiring new customers while neglecting the customers they already had. It's like filling a bucket with a hole in the bottom – exhausting and inefficient. The most successful companies balance both sides of the equation.
On the revenue growth side, consider optimizing your acquisition funnel to bring in more qualified leads who are likely to stick around. Develop a systematic approach to upselling existing customers – this is often your lowest-hanging fruit since these folks already trust you. Many companies find success with tiered pricing structures that naturally encourage customers to upgrade as they grow.
Meanwhile, don't neglect the denominator. The fastest way to improve your ratio often isn't selling more – it's losing less. Implement an improved onboarding process that helps customers see value quickly. Create an early warning system to identify unhappy customers before they leave. Consider shifting toward annual contracts which automatically reduce monthly churn opportunities.
For deeper insights into building an efficient customer acquisition strategy, check out our guide on SaaS Customer Acquisition Cost.
Reduce Churn & Contraction
Let's be honest – keeping existing customers is almost always cheaper than finding new ones. Research from Bain & Company found that just a 5% increase in customer retention can boost profits by 25-95%. That's why tackling the denominator of your SaaS quick ratio often yields the fastest results.
Fix your onboarding experience first and foremost. I've seen companies reduce early churn by 30% just by redesigning how they welcome new customers. Guide users to quick wins with your product, provide contextual help when they need it, and personally check in with high-value accounts during those critical first weeks.
Don't wait for customers to tell you they're unhappy – by then, it's often too late. Create meaningful feedback loops through regular NPS surveys, quarterly business reviews, and usage monitoring. The key isn't just collecting feedback but having a process to act on it quickly. Customers who see their feedback implemented become your most loyal advocates.
Consider the structural benefits of shifting to annual contracts. This simple change reduces the number of times customers reconsider their relationship with you each year. It gives you more runway to demonstrate value and creates natural switching costs. One client of ours increased their SaaS quick ratio by 1.5 points simply by converting 40% of monthly customers to annual plans.
Proactive support makes customers feel valued before problems arise. Use product analytics to spot declining engagement, create automated alerts for unusual patterns, and develop playbooks for your customer success team to follow when intervention is needed. As the Harvard Business Review research shows, companies excelling at customer experience have renewal rates five times higher than those with poor experiences.
Sometimes churn simply indicates product gaps that need addressing. Analyze why customers leave – especially those who move to competitors – and use those insights to guide your product roadmap. A customer advisory board can provide invaluable direction here.
Boost Expansion & New MRR
While plugging the leaks in your bucket is crucial, you still need to pour more water in. Increasing the numerator of your SaaS quick ratio requires thoughtful strategies for both acquiring new customers and expanding relationships with existing ones.
Well-designed pricing tiers create natural expansion opportunities as your customers grow. Design your tiers around value metrics that align with customer success – when they win, they naturally move up to higher tiers. One B2B SaaS client redesigned their pricing around the number of projects managed rather than users, immediately increasing expansion revenue by 22% as customers' project portfolios grew.
Consider how you bundle features to drive both new sales and expansions. Rather than offering every feature à la carte, create thoughtful packages that solve complete workflows for specific customer segments. This simplifies purchasing decisions for new customers while creating clear upgrade paths for existing ones.
Your current happy customers can be your best salespeople if you give them a reason to help. Formal referral programs with meaningful incentives can significantly boost new MRR without increasing marketing spend. Make referral requests a standard part of your customer success process, and recognize customers who bring in new business.
Don't overlook the importance of sales enablement for both new and expansion revenue. Equip your team with clear playbooks for identifying expansion opportunities, compelling case studies that demonstrate value, and compensation structures that reward growing existing accounts. In my experience, companies that align incentives around expansion revenue see 30-40% higher growth from existing accounts.
Lastly, build product-led growth mechanisms directly into your user experience. Create in-product upsell opportunities that appear at moments of high value, implement usage meters that highlight approaching limits, and design features that naturally encourage inviting colleagues. The best expansion revenue often comes when customers sell themselves on the need to upgrade.
For a deeper dive into maximizing customer value over time, explore our guide on SaaS Customer Lifetime Value.
The most successful SaaS companies I've worked with don't see improving their SaaS quick ratio as a one-time fix but as an ongoing discipline. They regularly review both sides of the equation, celebrate wins in reducing churn just as much as new sales, and build sustainable growth engines that get more efficient over time.
Limitations & Frequently Asked Questions about SaaS Quick Ratio
Let's be honest – no single metric can tell you everything about your SaaS business, and the SaaS quick ratio is no exception. While it's incredibly useful, it comes with limitations you should understand before making major decisions based solely on this number.
Think of the quick ratio as one instrument in your financial orchestra – valuable, but best when played alongside others. It gives you a clear signal about your growth trajectory, but doesn't tell the full story of how efficiently you're achieving that growth or why your numbers look the way they do.
The quick ratio shows if you're gaining or losing ground, but remains silent on whether you're spending a fortune to achieve those gains. That's why savvy SaaS leaders pair it with metrics like Customer Acquisition Cost (CAC), Lifetime Value (LTV), and the Rule of 40 to get the complete picture.
One common mistake is celebrating a high quick ratio without checking if it's built on sustainable foundations. After all, anyone can temporarily boost their numbers through aggressive discounting or by delaying the recognition of likely churn. The true test is whether your ratio remains healthy over time.
Your business stage and model also matter tremendously. A young B2C app naturally experiences different churn patterns than an established enterprise SaaS platform, so benchmark accordingly. What's "good" for one might be concerning for another.
Limitation #1: Directional, Not Efficiency
The SaaS quick ratio tells you which way your revenue ship is sailing and how fast – but not how much fuel you're burning to get there. This is perhaps its biggest limitation.
Imagine two SaaS companies with identical 4.0 quick ratios. On paper, they look equally healthy. But peek behind the curtain, and you might find Company A achieves this with a lean, targeted marketing approach and an efficient sales process. Meanwhile, Company B burns through venture capital with unsustainable ad spend and an army of salespeople to hit the same numbers.
The quick ratio treats both companies as equals, which is why you need companion metrics that reveal the efficiency story:
Ben Murray, widely known as "The SaaS CFO," puts it perfectly: "I would classify this metric as directional. It answers the question, 'what is our net inflow or outflow of MRR or ARR bookings?' It does not tell me anything about the financial efficiency of our bookings."
To truly understand if your growth is sustainable, pair your quick ratio with efficiency metrics like your CAC Ratio (how much it costs to acquire a dollar of ARR), CAC Payback Period (how long it takes to recoup acquisition costs), LTV:CAC Ratio (lifetime value created relative to acquisition cost), and the SaaS Magic Number (revenue growth relative to sales and marketing spend).
Growing efficiently at 3.5x might be healthier than growing inefficiently at 5x – something the quick ratio alone won't reveal.
Limitation #2: Data Quality & Segmentation
Your SaaS quick ratio is only as good as the data feeding it. Garbage in, garbage out – as the saying goes. And unfortunately, many companies struggle with accurate MRR tracking.
The seemingly simple task of categorizing revenue changes can become surprisingly complex. Did that revenue increase come from a new customer, or was it expansion from an existing one? Was that decrease due to a cancellation or just a temporary pause? These classification challenges can significantly skew your ratio.
Billing systems often contribute to the problem. One-time payments mistakenly classified as recurring revenue, promotional discounts not properly accounted for, or mishandled credits can all distort your ratio. I've seen companies find their quick ratio was completely wrong after cleaning up their billing data.
Timing issues are another common culprit. Recognizing revenue changes in the wrong period or having inconsistent timing between different components of the ratio can paint a misleading picture. Seasonal variations can make month-to-month comparisons particularly tricky.
Beyond data quality, there's another limitation: the aggregate nature of the quick ratio can mask segment-level problems. Your overall ratio might look healthy while hiding serious issues in specific customer segments or product lines.
Consider calculating separate quick ratios for different parts of your business – by customer size (enterprise vs. SMB), product line, customer cohort, geography, or acquisition channel. This more granular view often reveals opportunities or problems that company-wide metrics conceal.
I've worked with clients who found that their seemingly healthy quick ratio was propped up by one strong segment while another was in serious trouble. Without segment-level analysis, they might have missed the warning signs until it was too late.
Limitation #3: Stage & Model Differences
Not all SaaS businesses are created equal, and neither are their ideal SaaS quick ratios. The benchmarks that make sense for your company depend greatly on your growth stage and business model.
Early-stage startups often see wild swings in their quick ratio as they experiment with product and pricing. When you only have a handful of customers, a single churn event can dramatically impact your ratio. These companies should focus more on the trend than the absolute number, using the ratio to gauge whether their product-market fit is improving over time.
Growth-stage companies typically need higher ratios (4.0+) to attract further investment. At this stage, investors expect to see efficient growth that justifies continued funding. But as companies mature, operating with ratios between 2.0-4.0 becomes perfectly acceptable – especially when balanced with improving profitability metrics.
Your business model also dramatically affects what constitutes a "good" ratio. The standard benchmarks were developed primarily for traditional B2B SaaS companies with straightforward subscription models.
If you have usage-based pricing, expect more natural revenue fluctuations that make your ratio more volatile. Enterprise SaaS companies with longer sales cycles and lower churn patterns will see different ratio dynamics than high-volume, lower-priced B2C services. Seasonal businesses might need to use rolling averages to smooth out variations.
I recently worked with a client who was concerned about their 2.5 quick ratio until we analyzed competitive benchmarks for their specific industry niche and found they were actually outperforming peers. Context matters tremendously when interpreting this metric.
When benchmarking your SaaS quick ratio, always compare against companies with similar business models, target markets, and growth stages rather than applying universal standards.
FAQ 1 — How often should we track the SaaS Quick Ratio?
Finding the right cadence for tracking your SaaS quick ratio is like choosing the right prescription for glasses – what works perfectly for one company might leave another with blurry vision.
For most SaaS businesses, monthly tracking hits the sweet spot. It aligns nicely with standard financial reporting cycles and provides enough data points to spot meaningful trends without getting lost in day-to-day noise. This monthly cadence gives you time to identify concerning patterns before they become serious problems, make tactical adjustments to your sales and retention strategies, and report consistently to boards and investors.
If you're running a high-volume, lower-priced SaaS business (think B2C apps or self-service B2B tools), weekly tracking might make more sense. With hundreds or thousands of transactions flowing through your system, weekly analysis can provide earlier warning signals about sudden changes in conversion or churn rates. This faster feedback loop allows for quicker testing and iteration of acquisition tactics.
On the flip side, if you primarily serve enterprise customers with longer sales cycles, quarterly analysis might actually be more meaningful. Enterprise deals tend to be lumpy – a single large contract can dramatically impact your monthly numbers. Quarterly analysis smooths out this lumpiness and aligns better with typical enterprise renewal cycles.
Regardless of frequency, the SaaS quick ratio provides the most value when tracked consistently over time. Focus not just on the ratio itself but on the four components (new, expansion, churn, contraction) individually. Each tells its own story about your business health.
Many of our clients at Lineal CPA find it helpful to use rolling periods (like trailing 3-month or 12-month calculations) to smooth out volatility while still maintaining visibility into trends. We also recommend making the quick ratio a core KPI in executive dashboards and setting alert thresholds that trigger deeper reviews if the ratio drops below certain levels.
The goal isn't just to collect data – it's to gain insights that drive action.
FAQ 2 — Can a very high ratio be bad?
It seems counterintuitive, but yes – an extremely high SaaS quick ratio isn't always cause for celebration. Sometimes it can actually signal potential issues lurking beneath the surface.
For mature SaaS companies, an unusually high ratio (say, 8+) might indicate underinvestment in growth initiatives. It's like saving 80% of your income – admirable in some ways, but possibly a sign you're missing opportunities to invest in your future. The company might be playing it too safe with marketing and sales spending, prioritizing short-term profitability over long-term market position.
I've seen companies become so focused on maintaining a pristine quick ratio that they essentially handcuffed their growth teams. They turned down perfectly good growth opportunities because the initiatives would temporarily reduce their ratio, even though the long-term payoff would have been substantial.
For very early-stage companies, extremely high ratios can simply be mathematical quirks rather than meaningful indicators. When your denominator (churn and contraction) is tiny or even zero in the early days, your ratio can shoot to infinity. This doesn't mean you've found some magical growth formula – it just means you haven't been around long enough to experience normal churn patterns.
Sometimes a high ratio is achieved through unsustainable tactics like heavily discounted contracts that will face renewal challenges, overly generous terms that may lead to future contraction, or delayed recognition of known churn through contract structures. These approaches might make your numbers look good temporarily, but they're building a house of cards.
As venture investor Tomasz Tunguz wisely notes, "A very high quick ratio for later-stage companies might signal underinvestment back into the business despite strong top-line growth."
The optimal quick ratio varies by company stage, growth objectives, and market conditions. Rather than maximizing the ratio at all costs, focus on achieving a healthy, sustainable ratio that supports your overall business strategy.
FAQ 3 — Is the SaaS Quick Ratio useful for mature enterprises?
Absolutely – but like a fine wine, the SaaS quick ratio matures and transforms as your company grows. For established SaaS enterprises, it remains valuable but needs to be applied and interpreted differently.
First, adjust your expectations. While startups might aim for ratios of 4.0+, mature companies often operate successfully in the 2.0-4.0 range. Many public SaaS companies maintain ratios between 2.0-3.0 while achieving healthy growth. These lower ratios can be perfectly acceptable when balanced with strong profitability metrics and cash flow.
As companies mature, many shift their primary focus from the quick ratio to Net Revenue Retention (NRR). NRR measures revenue retained from existing customers, including both churn and expansion. A healthy NRR above 100% indicates that expansion exceeds churn within your existing customer base – essentially, your current customers alone are fueling growth. This metric tends to be more predictable and stable for mature companies with established customer bases.
For enterprises with multiple product lines or market segments, the aggregate quick ratio becomes less insightful. I've worked with mature SaaS companies that calculate separate ratios for different business units or product lines, using the metric to compare performance across segments and identify underperforming areas that might be masked in company-wide metrics.
Mature enterprises should also integrate the quick ratio into their comprehensive financial planning – using it as an input to revenue forecasting models, setting ratio targets as part of annual planning processes, and analyzing the impact of ratio changes on cash flow and profitability.
Public companies can even use approximated quick ratios for competitive analysis, calculating rough estimates for competitors using publicly disclosed metrics and comparing their performance against industry peers.
While the SaaS quick ratio may not be the primary metric for mature enterprises, it remains a valuable tool for monitoring growth efficiency when adapted to the company's stage and strategic objectives. The focus typically shifts from maximizing the ratio to optimizing it within a balanced framework of growth, profitability, and cash flow metrics.
Conclusion
The SaaS quick ratio has emerged as one of the most important metrics for subscription businesses because it provides a clear picture of growth efficiency that other metrics simply can't capture. By comparing revenue inflows (new and expansion MRR) against outflows (churn and contraction MRR), it reveals whether your growth is sustainable or merely masking underlying retention problems.
At Lineal CPA, we've seen how tracking and optimizing this ratio can transform SaaS businesses. As both a NetSuite partner and provider of fractional CFO services, we've watched companies with healthy quick ratios (above 4.0) consistently demonstrate stronger unit economics, more predictable growth, and ultimately achieve higher valuations than those struggling with efficiency.
Think of your SaaS quick ratio as the pulse check for your subscription business. When it's strong, your growth engine is humming along efficiently. When it weakens, it's an early warning system that something needs attention – perhaps your churn is creeping up or your new customer acquisition is slowing down.
Remember these key takeaways as you implement this metric in your business:
Balance is everything in the subscription world. The most successful SaaS companies don't chase new customers at the expense of retaining existing ones – they understand that sustainable growth requires addressing both sides of the equation. Your quick ratio helps maintain this balance by forcing you to consider both inflows and outflows.
Don't just look at the overall number. Calculate your SaaS quick ratio for different customer segments, product lines, and cohorts to uncover specific areas that need attention. Sometimes a healthy overall ratio can mask serious problems in particular segments of your business.
The ratio isn't meant to stand alone. Pair it with CAC, LTV, payback period, and other SaaS metrics for a complete picture of business health. Each metric tells part of your business story, and together they form a comprehensive narrative about your growth trajectory.
Your expectations should evolve as your company matures. Early-stage companies should typically target ratios above 4.0, while mature companies might operate successfully with ratios between 2.0-4.0 as they balance growth with profitability.
Finally, the ratio itself doesn't improve your business – it's the actions you take based on the insights it provides. Use it to drive strategic decisions about customer acquisition, product development, and customer success initiatives.
Implementing robust financial systems like NetSuite can make tracking the SaaS quick ratio and its components significantly easier, allowing you to focus on improving the metric rather than just calculating it. Our fractional CFO services can help you not only monitor this crucial metric but develop strategies to optimize it for sustainable growth.
For more insights on how to leverage financial metrics for SaaS success, explore our Fractional CFO services designed specifically for growing SaaS companies.